Pipe Stress Analysis Norway – Advanced Simulation and Engineering Solutions

Challenging Industry Norms in Advanced Pipe Stress Analysis and Structural Engineering Stressman Engineering AS is a Norway-based engineering consultancy specializing in advanced pipe stress analysis, pressure vessel calculations, and structural integrity assessments for high-demand industries including oil and gas, aquaculture, energy, and maritime sectors. Founded in 2011 by mechanical engineer Sondre Luca Helgesen, the company […]
Karrieredagen 2026

One foot in the classroom. One in a hard hat.That transition from student to professional can feel like a lot. That’s why we’re heading to Karrieredagen 2026 at the University of South-Eastern Norway, Campus Porsgrunn, to have real conversations, not just collect CVs. Stop by our booth to talk about what we actually do, and […]
1955 The Year Piping Design Found Its Voice

Back in 1955 (the year Piping Design found its voice), a paper quietly reshaped the way we understand piping systems. A man named A. R. C. Markl published “Piping Flexibility Analysis”, setting, for the first time, clear rules for calculating stress and fatigue in piping components. That milestone wasn’t a sudden leap; it was the […]
Effect of Bending Moment on Flanges and Theoretical Calculations for Leakage
A Comparative study of calculation methods and physical results By Eline R. Norschau, Jørgen S. Jensen, Ken K. L. Lien Introduction Most industry is built upon pipes and flanged connections. Every flange poses a risk of leakage, but due to engineering design and safety factors they should not leak when assembled correctly. The development of […]
Mollier Diagram
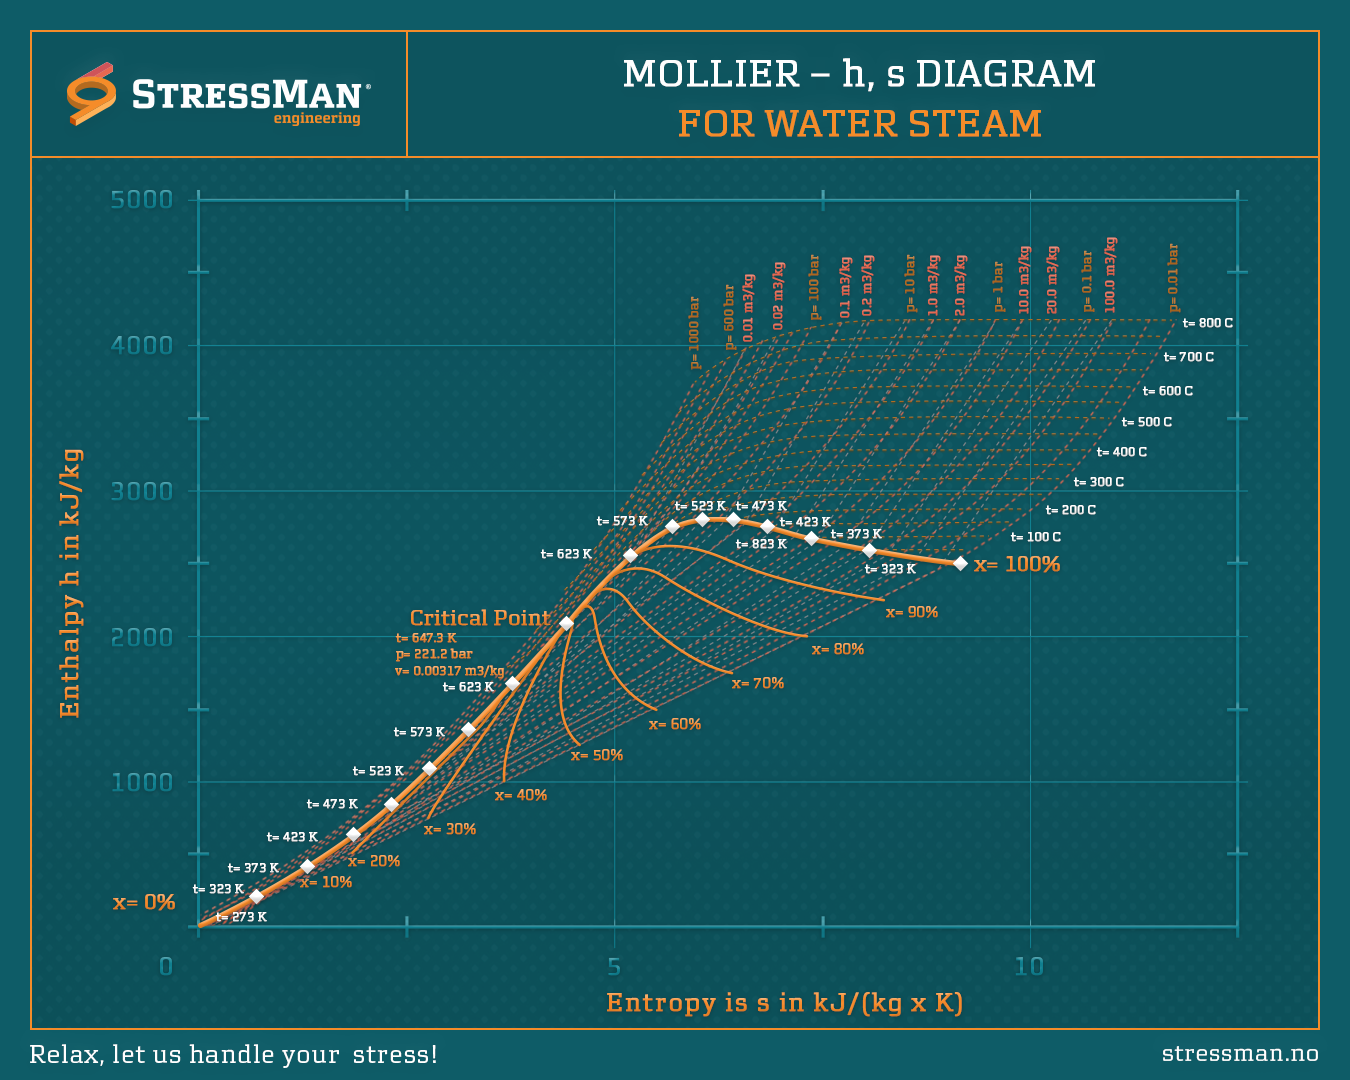
Harnessing Thermodynamics: The Power of the Mollier Diagram Every decision in energy systems holds the key to efficiency and sustainability. One powerful tool engineers rely on is the Mollier Diagram—a visual roadmap of enthalpy (h) versus entropy (s). Why it matters: The Mollier diagram isn’t just a chart; it’s a guide to designing efficient systems […]
Offshore Xmas Tree

What is an Offshore Xmas Tree? In the oil and gas world, an “offshore Xmas tree” isn’t about holiday decorations—it’s a critical piece of equipment used to control the flow from offshore wells! An offshore Xmas tree manages the flow of oil and gas, regulates well pressure, and ensures safety by isolating the well when […]
Pipe Stress Diagram
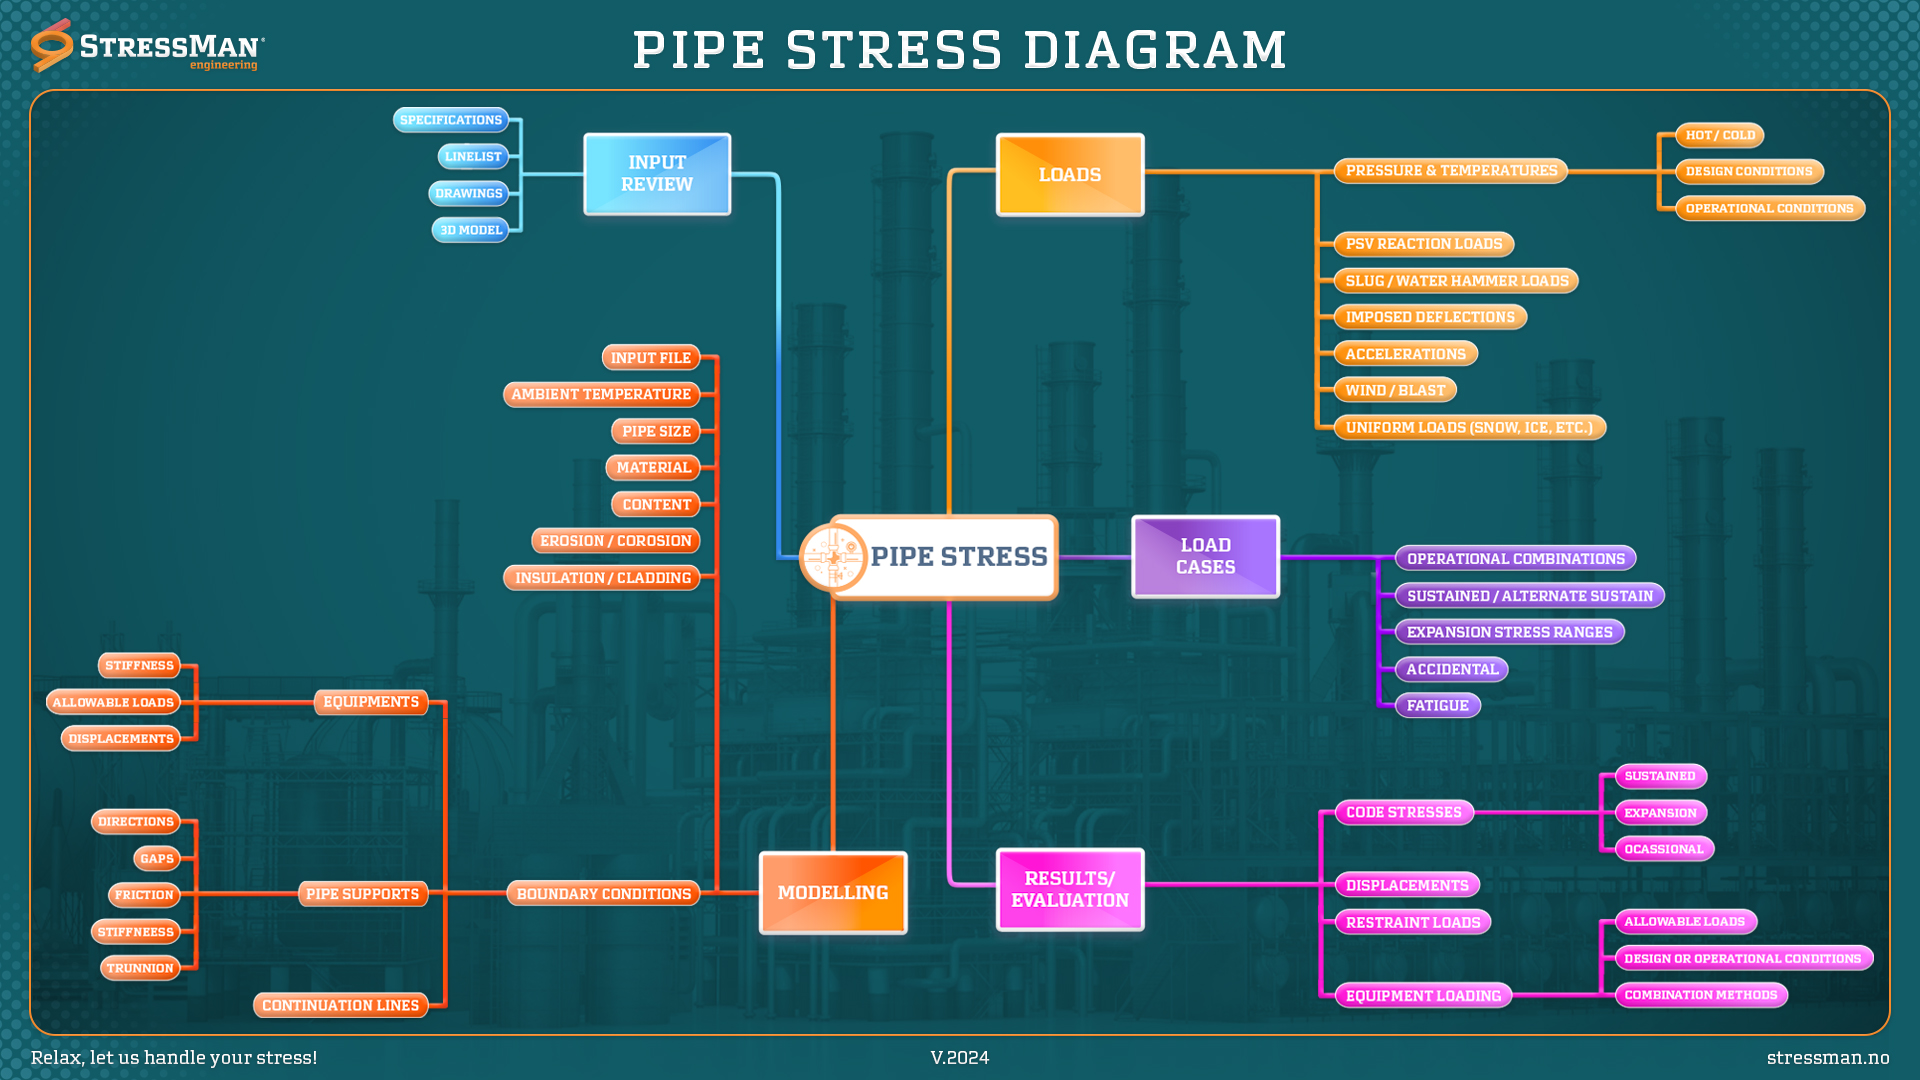
Pipe Stress: Simple, right? Just a hollow circle transfering stuff… If only it were that simple. Here at Stressman, we tackle pipe behavior challenges on a weekly basis. Pipes are almost like organisms. Restrain one part, and while you might be helping with load-controlled stresses, the strain-controlled ones could go through the roof. Finding that […]
Mathematical Notations

Mathematics is the universal language that bridges the gap between theoretical concepts and practical applications. As engineers, we rely on precise mathematical notations to communicate complex ideas, design innovative solutions, and solve intricate problems. Key Notations and Their Significance: – Basic Symbols (Numbers, Operators, Relations).– Algebra (Variables and Constants, Expressions).– Calculus (Derivatives, Integrals).– Linear Algebra […]
Orifice Plates: Precision in Flow Measurement
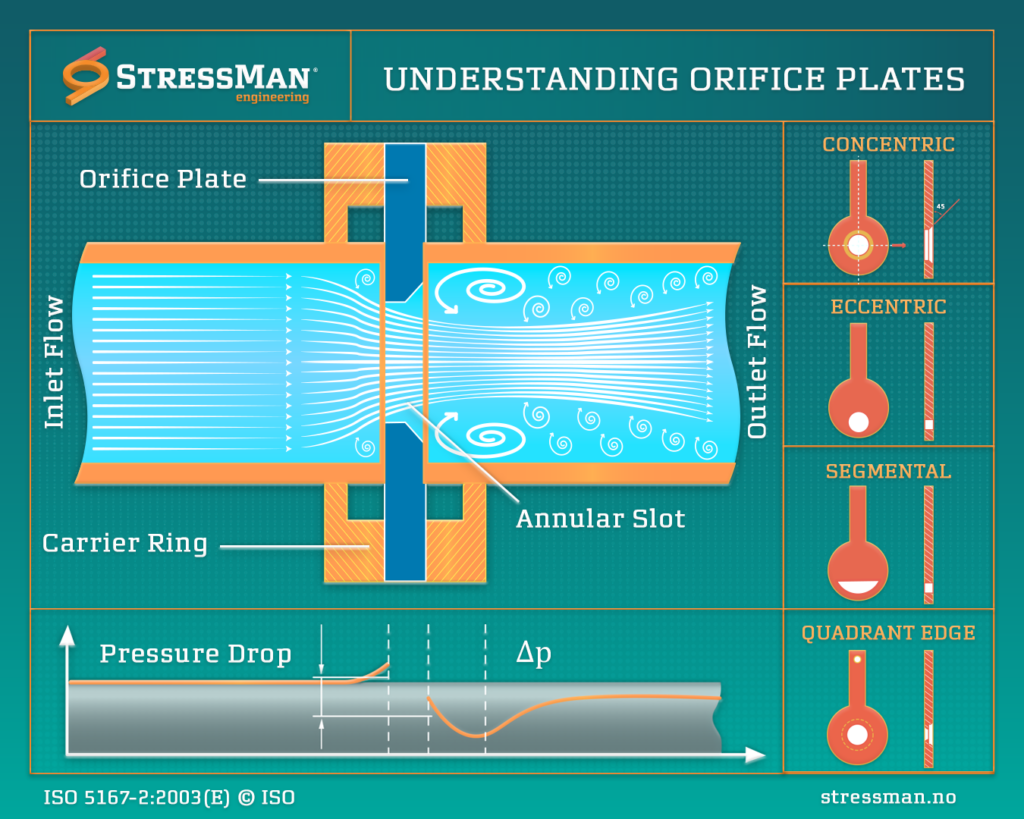
Orifice Plates: Precision in Flow Measurement Orifice plates adhering to the global standard ISO 5167-2 are essential tools in process industries for measuring fluid flow in pipelines. But how do they work, and what types are available? An orifice plate, a simple plate with a hole, is placed into a pipe. As the fluid passes […]
Stress Concentration Factors (SCF)

Understanding Stress Concentration Factors (SCF) is crucial in engineering and structural analysis. SCF is a dimensionless factor that reveals stress amplification at specific points like notches or cracks compared to the surrounding material. Why does it matter? The presence of stress concentrations is particularly significant in materials with limited ductility or those prone to fatigue […]