Performance curves for pumps are graphical representations of the pump’s capabilities under various operating conditions. These curves typically depict the relationship between different parameters such as flow rate, head (pressure), efficiency, and power consumption. Understanding these curves is crucial for selecting the right pump for a particular application and for optimizing its performance. Here’s a breakdown of the common performance curves:
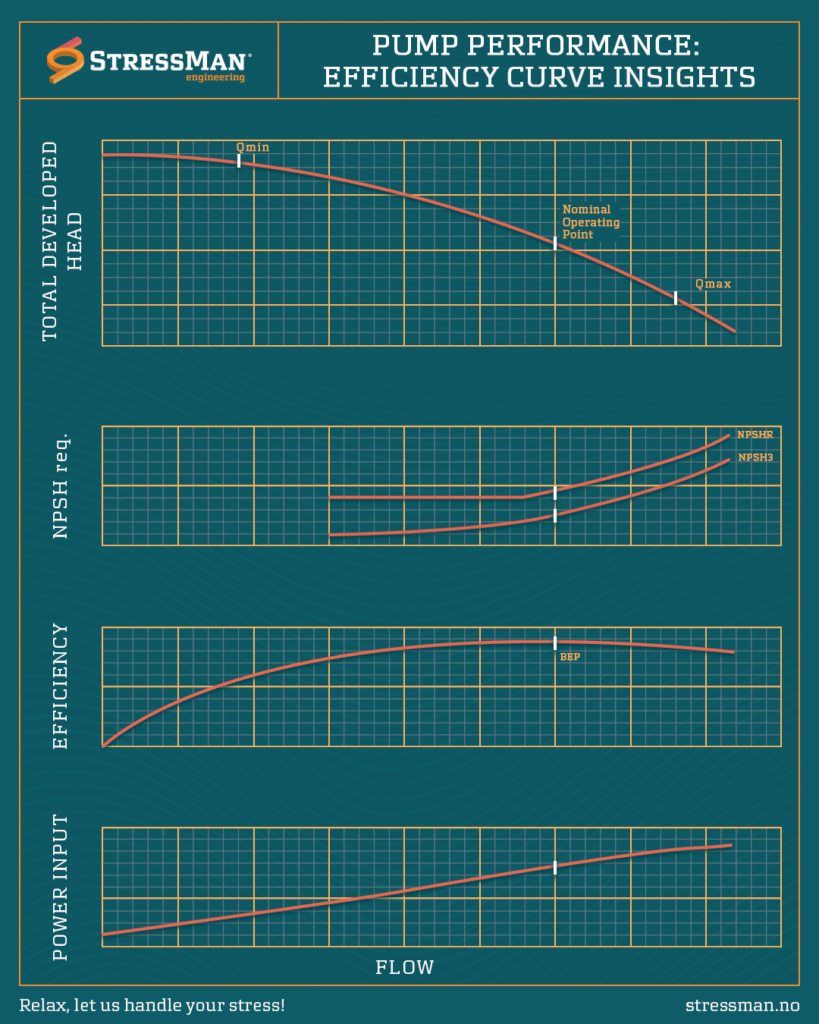
- Flow Rate vs. Head Curve: This curve illustrates the relationship between the flow rate (in gallons per minute, cubic meters per hour, etc.) and the head or pressure developed by the pump (in feet, meters, psi, bar, etc.). It shows how the pump’s head varies with changes in flow rate. Typically, as the flow rate increases, the head decreases, and vice versa.
- Efficiency Curve: The efficiency curve shows how efficiently the pump converts input power into useful hydraulic power. It depicts the relationship between efficiency (expressed as a percentage) and the flow rate. Pump efficiency is typically highest at the pump’s Best Efficiency Point (BEP), which is the point where the pump operates most effectively.
- Power Consumption Curve: This curve illustrates the relationship between power consumption (in kW, horsepower, etc.) and the flow rate. It shows how power requirements vary with changes in flow rate. At lower flow rates, the power consumption tends to decrease, while at higher flow rates, it tends to increase due to higher resistance and friction losses.
- Net Positive Suction Head Required (NPSHR) Curve: This curve represents the minimum pressure required at the pump inlet to prevent cavitation, which is the formation of vapor bubbles due to low pressure. It shows how the NPSHR varies with flow rate. Operating the pump below the NPSHR can lead to cavitation, which can damage the pump and reduce its efficiency.
- Operating Region: The operating region of the pump is typically indicated on the performance curves. It shows the range of flow rates and heads over which the pump can operate effectively without experiencing issues such as cavitation or excessive energy consumption.
Interpreting these curves allows engineers and users to select the right pump for a specific application, operate it efficiently, and troubleshoot any performance issues that may arise during operation. It’s important to note that the shape and characteristics of these curves can vary depending on the type of pump (centrifugal, positive displacement, etc.), design, and specific operating conditions.