Psychrometric charts are graphical representations of the thermodynamic properties of moist air. They provide a visual way to analyze and understand the relationships between temperature, humidity, and other properties of air. One important parameter represented on a psychrometric chart is the dew point.
The dew point is the temperature at which air becomes saturated with water vapor, leading to the formation of dew, fog, or clouds. On a psychrometric chart, the dew point is indicated by the curved line known as the saturation line or 100% relative humidity line. In other words, the dew point is the temperature to which the air needs to be cooled at a constant pressure in order to achieve a relative humidity of 100%.
Here are a few key concepts related to psychrometric charts and dew points:
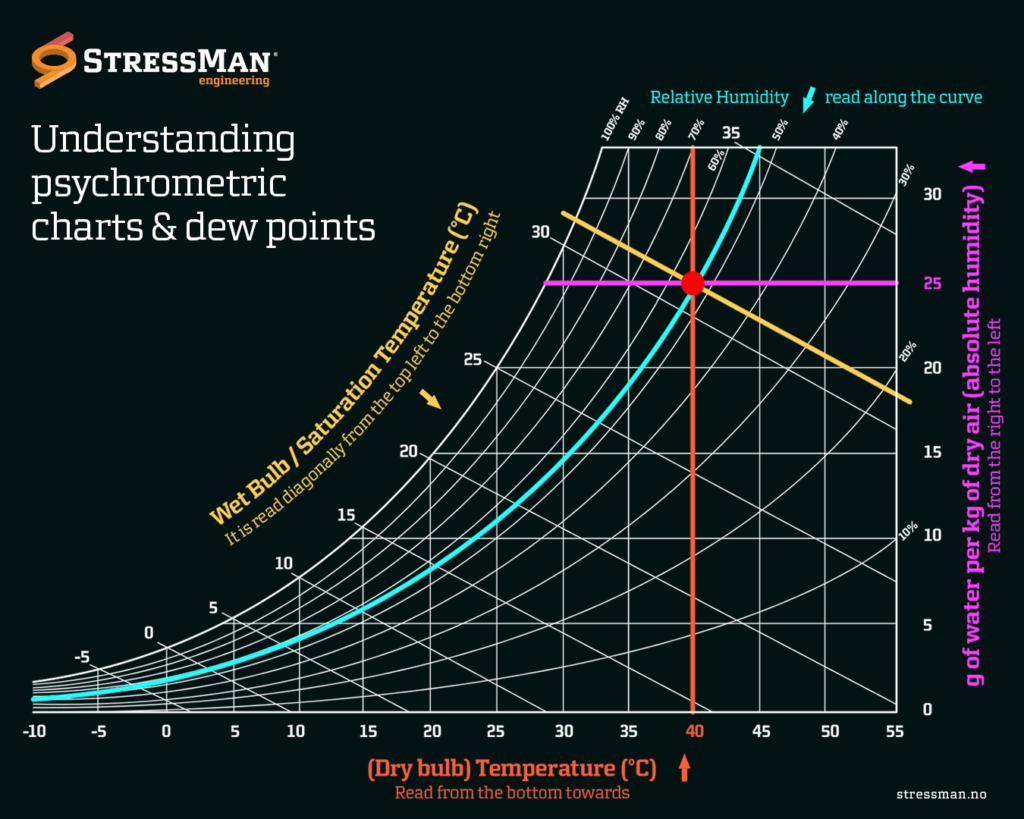
• Temperature and humidity: The horizontal axis of a psychrometric chart represents dry-bulb temperature, which is the air temperature measured with a regular thermometer. The vertical axis represents specific humidity, which is the mass of water vapor present in a unit mass of dry air.
• Relative humidity: Relative humidity (RH) is the ratio of the actual amount of water vapor present in the air to the maximum amount of water vapor the air can hold at a given temperature. It is represented by curved lines on the psychrometric chart called constant relative humidity lines. The point where the ambient air properties intersect the relative humidity line gives the conditions of the air.
• Dew point temperature: The dew point temperature is the temperature at which air reaches saturation, resulting in condensation. It is represented by the saturation lines on the psychrometric chart. The dew point temperature can be read directly from the chart by finding the intersection of the ambient air conditions with the saturation line.
• Sensible heating and cooling: Sensible heating or cooling refers to changes in the dry-bulb temperature of air without changing its moisture content. This is represented by vertical lines on the psychrometric chart.
• Latent heating and cooling: Latent heating or cooling refers to changes in the moisture content of air without changing its dry-bulb temperature. This occurs during processes like evaporation or condensation.
By analyzing a psychrometric chart and understanding the dew point, one can determine properties such as humidity levels, and cooling or heating requirements, and design efficient HVAC systems for various applications.
It’s worth noting that psychrometric charts are constructed based on specific assumptions and conditions, such as standard atmospheric pressure. Real-world applications may require adjustments based on actual conditions and additional calculations to achieve accurate results.