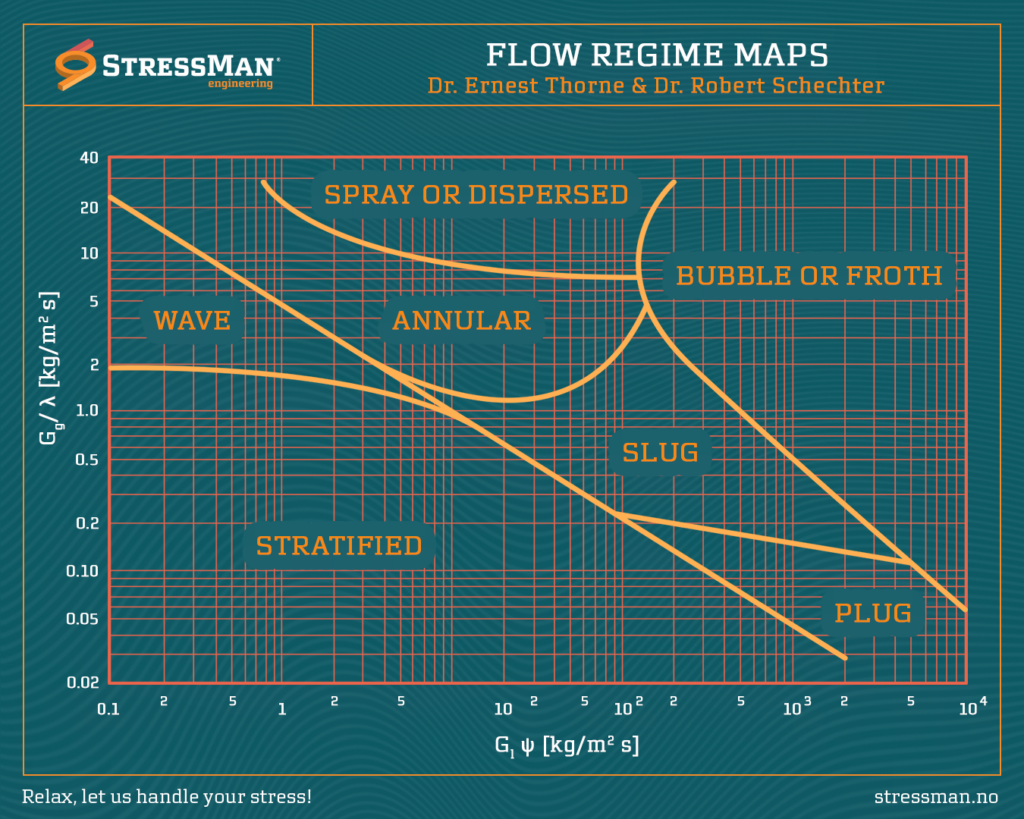
Flow pattern maps play a pivotal role in visualizing and comprehending the complex dynamics of gas/liquid flow in horizontal pipes under different operating conditions. These maps serve as valuable tools for engineers and researchers, providing a representation of the prevailing flow regimes.
Key Components of Flow Pattern Maps:
1.- Flow Regime Zones:
Flow pattern maps are typically divided into distinct zones, each representing a specific flow regime. These zones help identify the dominant pattern based on the prevailing flow conditions.
2.- Operating Parameters:
Flow pattern maps often include axes representing relevant operating parameters, such as gas and liquid flow rates, pipe diameter, and fluid properties. These parameters influence the transitions between different flow patterns.
Interpreting Flow Pattern Maps:
1.- Identifying the Current Flow Regime:
Engineers can use flow pattern maps to identify the current flow regime in a given system by locating the point corresponding to the operating parameters.
2.- Transition Prediction:
Understanding the map allows predictions about potential transitions between flow patterns as operating conditions change. This foresight is crucial for optimizing system performance.
3.- Design Optimization:
Engineers can leverage flow pattern maps during the design phase to select appropriate pipe diameters, control mechanisms, and other system parameters for desired flow patterns.
In conclusion, flow pattern maps are important tools for engineers involved in fluid dynamics and pipeline design. Their application extends across various industries, contributing to the optimization and reliability of systems.
By integrating the insights gained from flow pattern maps, engineers can make informed decisions that positively impact the performance of critical processes.