
Ever wondered how engineers navigate the complex world of fluid dynamics? The Moody Diagram, named after engineer and physicist Lewis F. Moody, is a crucial tool for understanding fluid flow, designed to assist engineers in efficiently designing pipelines, ducts, and channels.
The Basics: What is the Moody Diagram?
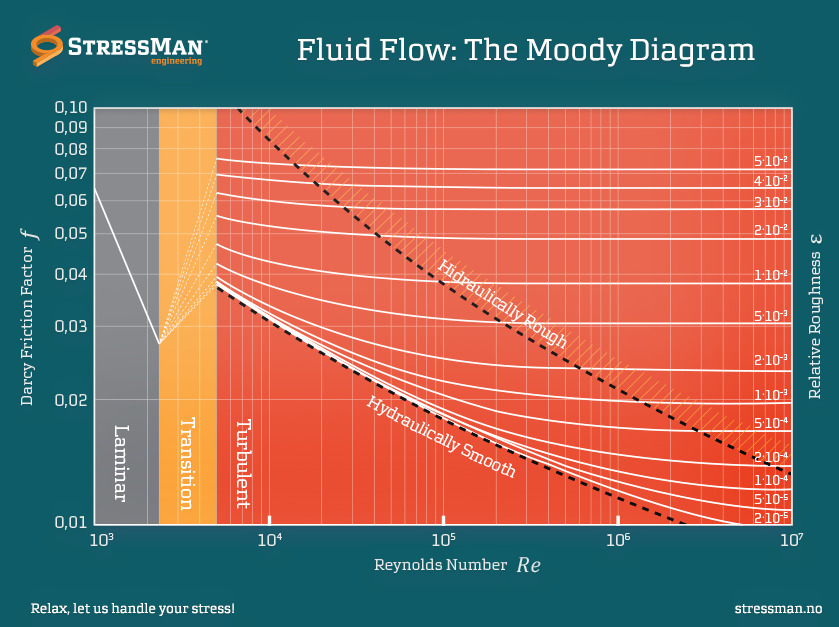
This iconic diagram graphically represents the Darcy-Weisbach equation, illustrating the relationship between friction factor, Reynolds number, and relative roughness in fluid flow. Notably, it provides a roadmap for understanding fluid behavior in pipes and conduits.
Upon review, a clarification is made: the Moody diagram showcases the relationship for the Darcy-Weisbach friction factor based on Reynolds number and roughness, rather than precisely the Darcy-Weisbach equation.
Historically, engineers grappled with challenges in using the Colebrook-White equation, but with contemporary numerical solutions, this difficulty has diminished.
Why is it Important?
Fluid flow is fundamental in engineering applications, and the Moody Diagram is indispensable for determining pressure drops, optimizing pipe sizes, and ensuring efficient design. It guides material selection, predicts flow regimes, and minimizes energy losses.
The Components of the Moody Diagram:
1.- Friction Factor (f): Characterizes resistance to fluid flow, allowing engineers to find the factor for a specific Reynolds number and relative roughness.
2.- Reynolds Number (Re): A dimensionless parameter indicating flow regime—laminar, turbulent, or transitional. The Moody Diagram assists in identifying the Reynolds number and its impact on flow behavior.
3.-Relative Roughness (ε/D): The ratio of pipe wall roughness to diameter, aiding in assessing the pipe’s surface influence on fluid flow.
How to Use the Moody Diagram:
1.- Determine Reynolds number and relative roughness.
2.- Locate the point on the Moody Diagram.
3.- Read the corresponding friction factor.
Beyond the Diagram: Applications in the Real World
The Moody Diagram isn’t just theoretical; it’s a practical guide for engineers in real-world scenarios. Whether designing water systems or optimizing HVAC ducts, this diagram empowers decisions that balance efficiency, cost, and reliability.
Conclusion: Navigating the Fluid Frontier
In fluid dynamics, the Moody Diagram stands as a beacon of understanding. As technology advances, this timeless tool continues shaping the infrastructure supporting our modern life.
When turning on a tap or marveling at a pipeline, remember the Moody Diagram—the unsung hero of fluid engineering!