Thermodynamics studies the relationship between heat, work, and energy in a system. Phase diagrams and various graphical representations, such as p-v (pressure-volume) and T-v (temperature-volume) diagrams, are essential tools in thermodynamics to understand and analyze the behavior of substances under different conditions.
1. Phase Diagrams:
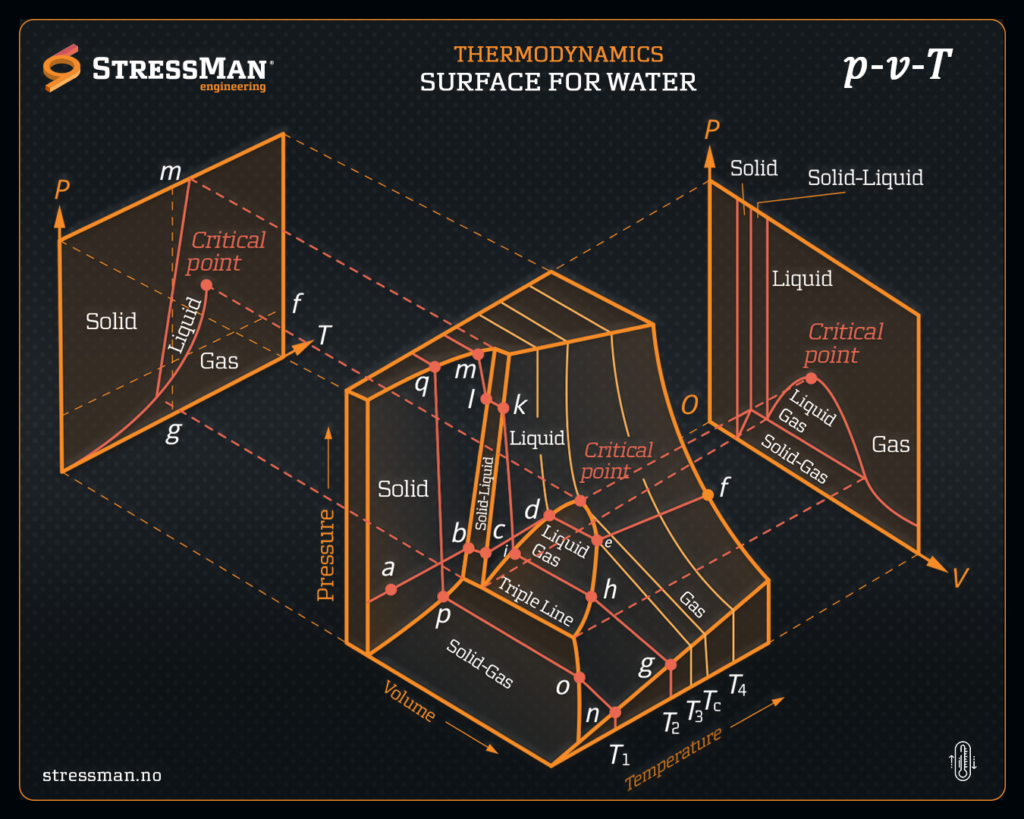
A phase diagram is a graphical representation that shows the different phases (solid, liquid, gas) of a substance as a function of temperature and pressure at a constant composition.
In a typical phase diagram, you’ll see regions representing each phase (solid, liquid, gas) separated by lines called phase boundaries. These boundaries indicate the conditions at which two phases can coexist in equilibrium.
For example, the phase diagram of water shows how temperature and pressure affect whether water exists as ice, liquid water, or vapor.
2. p-v Diagram (Pressure-Volume Diagram):
A p-v diagram is used to visualize the thermodynamic processes of a substance in terms of changes in pressure and volume.
In a p-v diagram, pressure is usually plotted on the vertical axis (y-axis), and volume is plotted on the horizontal axis (x-axis).
Different processes, such as isothermal (constant temperature) or adiabatic (no heat exchange), can be represented as lines or curves on the p-v diagram. For example, an isothermal process is represented as a hyperbola.
The area under the curve on a p-v diagram represents the work done during a thermodynamic process.
3. T-v Diagram (Temperature-Volume Diagram):
A T-v diagram is similar to a p-v diagram but represents processes in terms of changes in temperature and specific volume (volume per unit mass) rather than pressure and volume.
Temperature is usually plotted on the vertical axis (y-axis), and specific volume is plotted on the horizontal axis (x-axis).
T-v diagrams are particularly useful for analyzing the behavior of ideal gases because the relationship between temperature and specific volume is linear for ideal gases (according to the ideal gas law).
Key Concepts:
Phase transitions, such as melting, vaporization, and sublimation, are often indicated on phase diagrams as lines or curves where phase changes occur.
Critical points are specific conditions (temperature and pressure) beyond which a substance cannot exist in distinct liquid and gas phases.
Triple points are unique conditions where three phases (solid, liquid, and gas) coexist in equilibrium.
These diagrams and concepts are fundamental in thermodynamics and help engineers and scientists analyze and design systems involving heat and work interactions. They provide a visual representation of how substances behave under different conditions, aiding in the understanding of complex thermodynamic processes.