Flow-Regime-Maps

Understanding Flow Pattern Maps

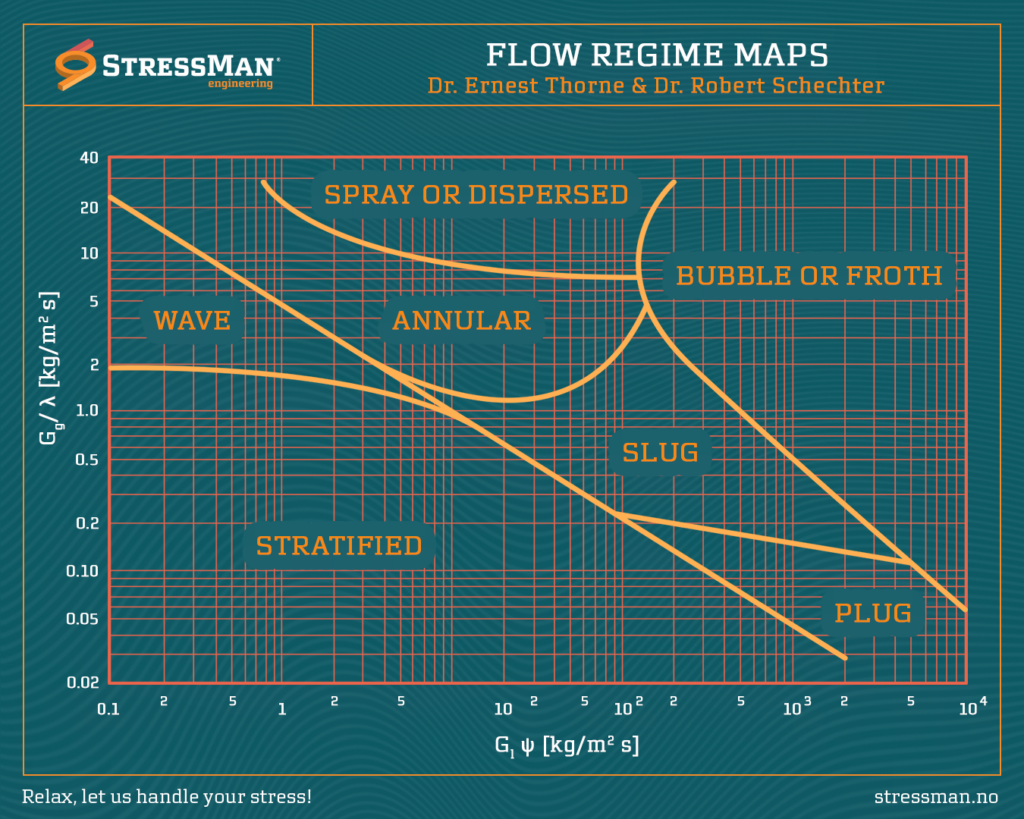
Flow pattern maps play a pivotal role in visualizing and comprehending the complex dynamics of gas/liquid flow in horizontal pipes under different operating conditions. These maps serve as valuable tools for engineers and researchers, providing a representation of the prevailing flow regimes. Key Components of Flow Pattern Maps: 1.- Flow Regime Zones: Flow pattern maps […]

Understanding Flow Pattern Maps Read More »

Introduction-to-Phase,-p-v-and-T-v-Diagrams

Thermodynamics – Surface for water

Thermodynamics studies the relationship between heat, work, and energy in a system. Phase diagrams and various graphical representations, such as p-v (pressure-volume) and T-v (temperature-volume) diagrams, are essential tools in thermodynamics to understand and analyze the behavior of substances under different conditions. 1. Phase Diagrams: A phase diagram is a graphical representation that shows the

Thermodynamics – Surface for water Read More »

Slug-Force-Calculation

Understanding and Preventing Slug Flow in Process Piping Systems

Introduction: Slug flow is a multiphase flow phenomenon observed in piping systems, characterized by the periodic formation of liquid slugs projected at a high (gas) velocity. This phenomenon can lead to dynamic fluid forces due to changes in momentum, inducing vibrations that may result in structural damage. To mitigate the risks associated with slug flow,

Understanding and Preventing Slug Flow in Process Piping Systems Read More »

Unlocking the Secrets of Fluid Flow: The Moody Diagram

Ever wondered how engineers navigate the complex world of fluid dynamics? The Moody Diagram, named after engineer and physicist Lewis F. Moody, is a crucial tool for understanding fluid flow, designed to assist engineers in efficiently designing pipelines, ducts, and channels. The Basics: What is the Moody Diagram? This iconic diagram graphically represents the Darcy-Weisbach

Unlocking the Secrets of Fluid Flow: The Moody Diagram Read More »